Google Analytics comes with lots of standard reports and settings, but with a little customisation you can extract much more value.
One way is to create custom reports, dashboards, and segments to interrogate your data in various different ways.
In this post I’ll demonstrate how to create a custom segment, for the analytics beginners out there.
Why do you need segments?
They offer some very useful insight which allows you to learn more about your audience behaviour.
For example, you can use segments to see which visitors arrived at your site using a mobile device, which country they are in, sessions which resulted in a conversion, and so on.
Google has ‘pre-loaded’ analytics with a number of useful segments which you can use straight away.

There are a number of ways to use segments, here are some suggestions:
- Segment by visitor type.
- Referrer or traffic source.
- By country /region.
- Value.
- Demographics.
- Device/browser used.
- How many users performed a site search.
- Paid traffic.
- Users with multiple sessions, as below:

Useful though these segments are, if you want to know something that Google hasn’t included in this list, or mix and match, you’ll need to create your own. This allows you to match the data more towards your own business goals.
How to create a segment
First of all, head to your Google Analytics account, and you should see the ‘Add Segment’ link:
Click that link, then the ‘new segment’ option:
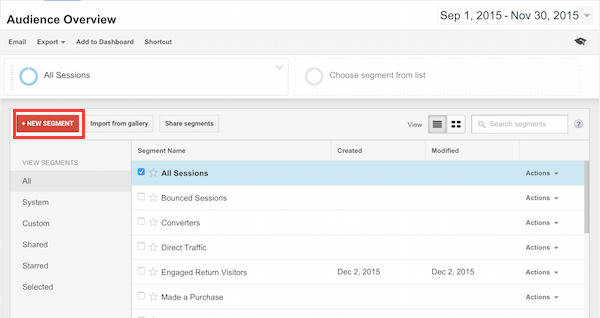
You’ll then see this page where you can begin to create the segment.
I’d start by naming it so you can find it easily when you need to.
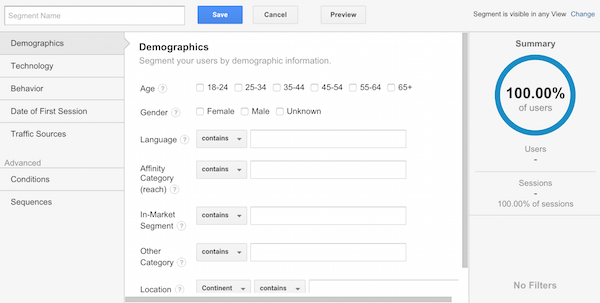
In this case, I’m creating a segment to show how many visitors view three or more pages, with the aim of measuring engagement with the site.
There are a few ways to do this, (Read more...) if a good number of people viewing more than three pages, then it suggests that your content is hitting the mark and that features such as links to related content are working well.
The percentage summary on the right is useful, as you can see what effect the filters you add are having. It also tells you that the demographic information is less than perfect, with no gender data on almost 49% of our visitors.
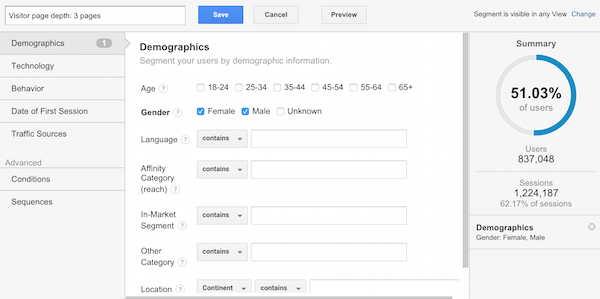
The categories on the left (demographic, technology etc) are easy enough to understand. You can mix and match quite easily, combining information on technology and browsers used with, for example, traffic sources.
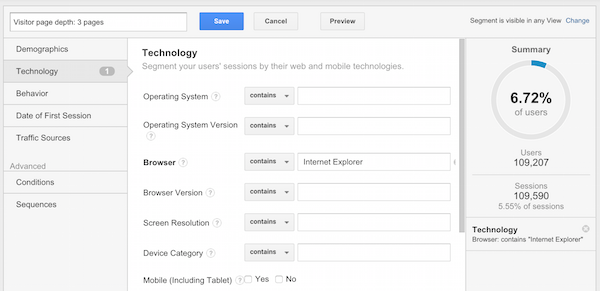
For the segment we’re creating though, we need to click on ‘conditions’:

You can scroll down the categories on the drop-down, but there are a lot of them so the search box helps:

For this segment, I’ve selected:
- Page depth, under the behaviour category.
- Greater than three pages.
You can also add other conditions. For example, we can add a geographical filter to show how users from different countries behave on the site.
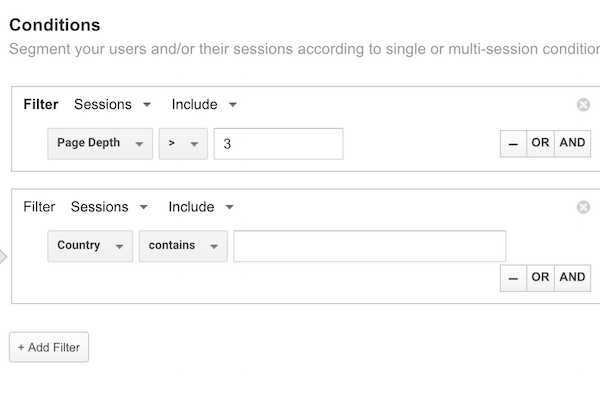
In this case, I’m leaving out the country data, but you can see how you can add other conditions till you arrive at more specific segments.
If the percentage sign on the right is 0%, then that will suggest you’ve made a mistake, or perhaps filtered to the point where you have no data.
Then simply click save and you’ll have your results. In this case, I can see the number of visits with that page depth, as well as the percentage.

You can slice and dice the data as you like to see things like:
- Visitors viewing more than 3 pages by region.
- Any correlation between traffic sources and engagement.
- Demographics.
- Differences between mobile and desktop.
In summary
Segments really help to bring Google Analytics to life, and allow marketers to tailor the platform to their own needs.
I’d argue that it’s an absolutely essential feature, though 41% of Google Analytics users aren’t creating their own segments.
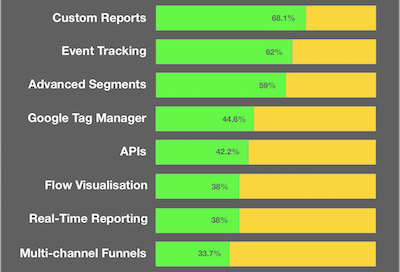
As demonstrated here, it’s relatively easy to set one up, and Google Analytics makes it easy to experiment with them through trial and error. If you create one and it doesn’t work, just delete and try again.
A good idea for an experiment is to copy an existing segment and adapt it to your own needs. Google has some more advice here.
If you want the segment I just created without going through these steps, here it is. Just click on the link while you’re logged into your Google Analytics account and you can save it.
Related reading
I’ve often looked at bounce rates and associated metrics as a way to measure the general stickiness and appeal of a website. ... read more
The terms that customers type into your site search function can help you to gain an understanding of user behaviour and can be used to optimise ... read more
Yesterday was the first day of ClickZ Live and Shift San Francisco, an event which attracted more then 500 attendees. It featured speakers from Accenture, ... read more


