Back in 2010, Google announced that it would start considering site speed as a ranking factor. Over the last few years, Google has gradually announced new website performance metrics and deployed ranking updates based on these metrics.
Let’s take a look at these changes and what you can do to improve the performance of your website.
What are Google’s Core Web Vitals?
The Core Web Vitals is a set of three user experience metrics defined by Google:
- Largest Contentful Paint
- Cumulative Layout Shift
- First Input Delay
Google has defined a maximum threshold for each of these metrics and if a website doesn’t meet all of these thresholds it will rank lower in search results.
Largest Contentful Paint
Largest Contentful Paint (LCP) measures how quickly page content appears on a page. Specifically, it looks at the largest page element, usually text or an image.
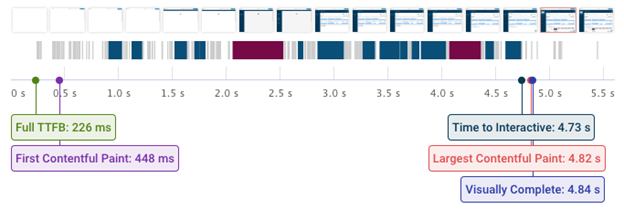
This rendering filmstrip shows what a visitor can see at different times after navigating to the page. You can see that it takes 762 milliseconds for the largest content element to appear.
Cumulative Layout Shift
Cumulative Layout Shift (CLS) measures whether page content shifts around after appearing. Page elements that move after being shown are disorienting to the user and can cause them to accidentally click on the wrong link or button.
The example in the screenshot below shows layout shift that occurs when an image loads and pushes the rest of the content down the page.
First Input Delay
First Input Delay (FID) measures how quickly the page reacts to user interaction. If there is a significant delay between clicking a button and that click being handled by the page that means the user (Read more...) to wait longer to get a response.
The blue and red markers in this visualization show times when the page is busy running processing tasks on the CPU. If the user interacts with the page at these times their interaction won’t be handled until after the in-progress processing task is complete.
How to test the loading speed of your website
You can use the free DebugBear speed test to see how fast your website loads.
The test result will show you two types of data:
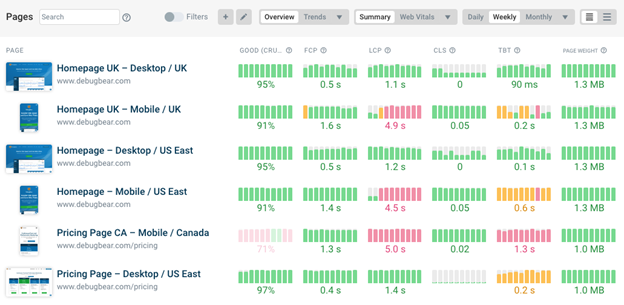
- Real-user data from that Google collects as part of the Chrome User Experience Report and that’s used as a ranking signal
- Lab data that’s collected in a controlled test environment and provides a deep analysis of your website
You’ll also get detailed recommendations to optimize your page speed.
Optimizing Core Web Vitals
What you can do to speed up your website depends a lot on what’s slowing it down. However, here are a few common issues to look out for.
First, check if your server response time is slow. If the page document doesn’t load quickly none of the other page content can start loading.
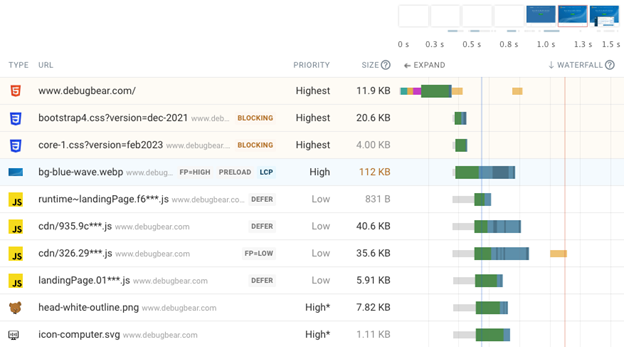
Second, check what resources on the page are render-blocking. That means the browser needs to load these resources before showing any content on the page. To optimize your website you can either remove these resources, make them load faster by reducing their size, or make them load asynchronously so they don’t block rendering.
Finally, ensure that the main content of your website appears quickly. If the largest element on your website is an image, the new Priority Hints browser feature is a quick way to load this content sooner. This allows you to mark important images in the source code of your website so that browsers load these images early.
Conclusion
Page speed has increased as a ranking factor in the last few years. But that’s not the only reason why page speed is important. A fast website that provides a good user experience also leads to higher conversion rates and is cheaper to operate.
If you want to optimize and monitor you can sign up for a free 14-day trial of DebugBear. Simply enter the URL of your website and those of your competitors to start tracking performance.


